# Airdoc / Opticare Age Analysis
# Note: this code assumes you previously loaded `data_file` with the path to your valid Excel spreadsheet
library(tidyverse)
library(ggplot2)
library(lubridate)
library(scales)
library(showtext)
showtext::showtext_auto()
opticare_colors <- c(
"White" = "#ffffff",
"Black" = "#191919",
"LightBlue" = "#94d4ff",
"Blue" = "#0b6edc",
"DarkBlue" = "#2d00a8",
"Pink" = "#f9bdde",
"Green" = "#42cb42",
"Yellow" = "#fbe54d",
"Orange" = "#ec652b"
)
theme_opticare <- function() {
theme_minimal() +
theme(
text = element_text(family = "Open Sans", color = opticare_colors["White"]),
plot.background = element_rect(fill = opticare_colors["DarkBlue"], color = NA),
panel.background = element_rect(fill = opticare_colors["LightBlue"], color = NA),
legend.background = element_rect(fill = opticare_colors["LightBlue"]),
legend.key = element_rect(fill = opticare_colors["White"], color = NA)
# Add other theme elements as needed
)
}
data_file <- file.path(opticare_file_path, "OpticareReportsSprague.xlsx")
# Read the Excel file
raw_opticare <- readxl::read_excel(data_file,
col_types = c(
"date",
rep("numeric", 3),
"text",
rep("numeric", 6),
rep("text", 2)
)
)
raw_opticare$Time <- as.POSIXct(raw_opticare$Time * 86400, origin = "1970-01-01", tz = "UTC")
raw_opticare$DateTime <- raw_opticare$Date + hms::as_hms(raw_opticare$Time)
a <- (70 - 35) / (45 - 10) # (y2 - y1) / (x2 - x1)
b <- 35 - (a * 10) # y - ax
# Assuming 'DateTime', 'Retinal Age', 'Cognitive', and 'Macular Vision' are correctly formatted and exist in 'raw_opticare'
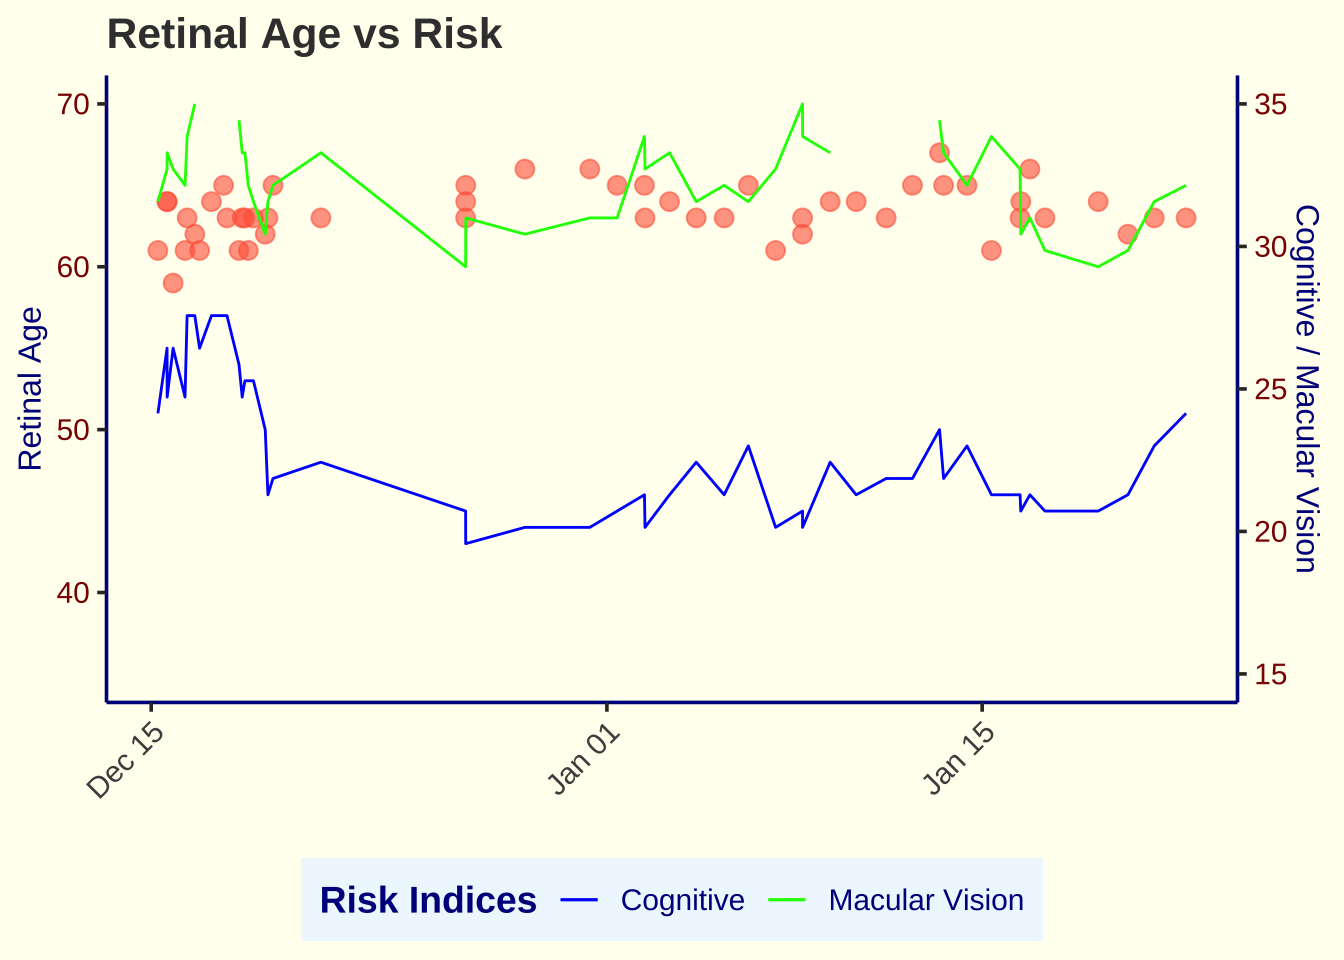
opticare_plot <- raw_opticare %>%
dplyr::filter(DateTime >= as_datetime("2023-12-15")) %>%
ggplot() +
geom_point(aes(x = DateTime, y = `Retinal Age`), color = "tomato", size = 3, alpha = 0.6) +
geom_line(aes(x = DateTime, y = (`Cognitive` * a + b), color = "Cognitive")) +
geom_line(aes(x = DateTime, y = (`Macular Vision` * a + b), color = "Macular Vision")) +
scale_y_continuous(
name = "Retinal Age",
limits = c(35, 70),
sec.axis = sec_axis(~ (. - 35) * (35 - 15) / (70 - 35) + 15, name = "Cognitive / Macular Vision")
) +
scale_color_manual(values = c("Cognitive" = "blue", "Macular Vision" = "green")) +
guides(color = guide_legend(title = "Risk Indices")) +
labs(
title = "Retinal Age vs Risk",
x = element_blank(),
y = "Values"
) +
theme_classic(base_size = 14) +
theme(
plot.title = element_text(face = "bold", color = "#3C3C3C", size = 16),
plot.background = element_rect(fill = "ivory", color = NA),
panel.background = element_rect(fill = "ivory", color = NA),
axis.title.x = element_text(color = "darkblue", size = 12),
axis.title.y = element_text(color = "darkblue", size = 12),
axis.text.x = element_text(angle = 45, hjust = 1, vjust = 1),
axis.text.y = element_text(color = "darkred"),
axis.line = element_line(color = "darkblue"),
legend.background = element_rect(fill = "aliceblue"),
legend.title = element_text(face = "bold", color = "darkblue"),
legend.text = element_text(color = "darkblue"),
legend.position = "bottom"
)
opticare_plot