| Experiment | IAUC | Min | Max | Rise |
|---|---|---|---|---|
| 1234-4/1-Whole Wheat bread | 2371 | -11 | 72 | -11 |
| 1234-4/4-Whole Wheat bread | 2536 | -14 | 63 | -14 |
| 1234-4/2-Whole Wheat bread | 3158 | 0 | 54 | 26 |
this is a draft posting…I’ll be updating it as I complete my experiments and analysis
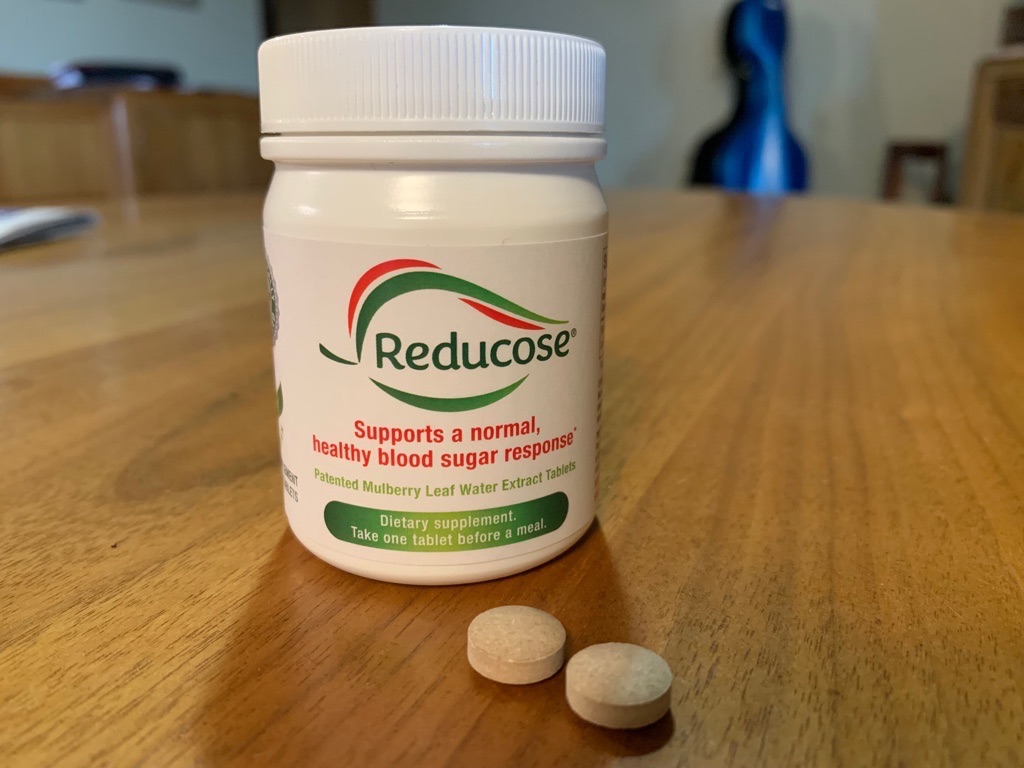
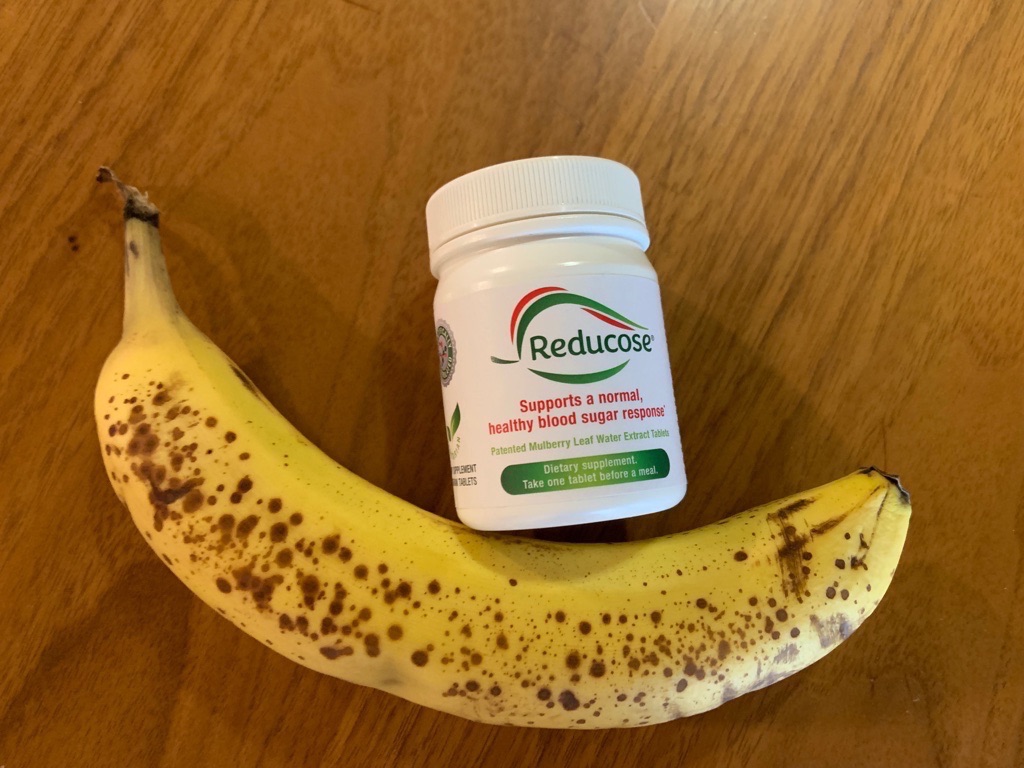
Some friends at Phynova heard about my CGM experiments and asked me to try their new supplement, Reducose, which contains a proprietary extract of Mulberry leaves which they claim can reduce a person’s glucose response by up to 40% with no side effects. I’ve been testing it on myself to find out.
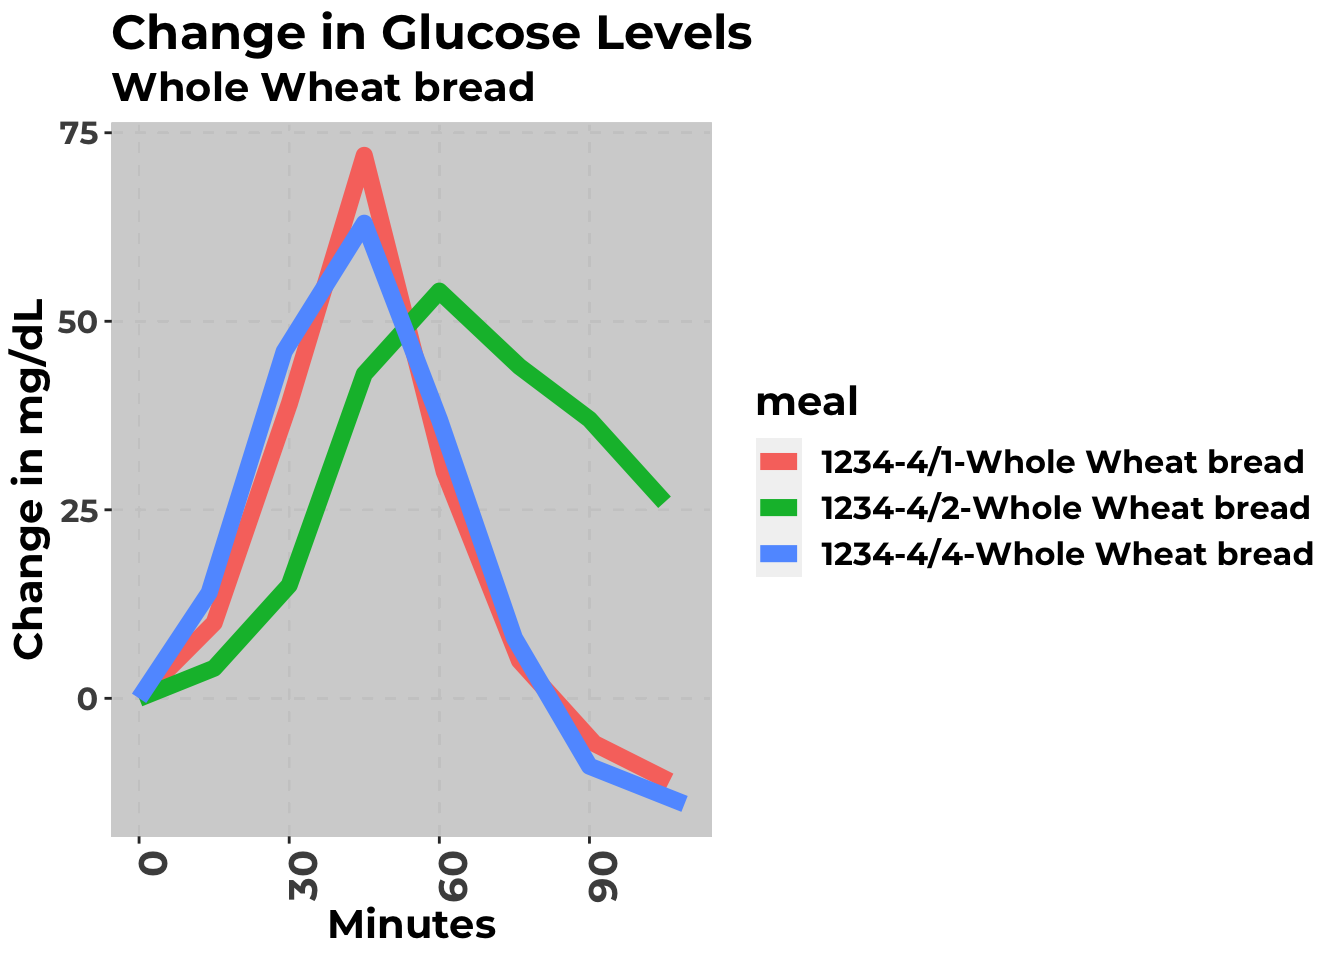
It seemed very effective when I tried it with different types of bread.
| Experiment | IAUC | Min | Max | Rise |
|---|---|---|---|---|
| 1234-4/1-Whole Wheat bread | 2371 | -11 | 72 | -11 |
| 1234-4/4-Whole Wheat bread | 2536 | -14 | 63 | -14 |
| 1234-4/2-Whole Wheat bread | 3158 | 0 | 54 | 26 |
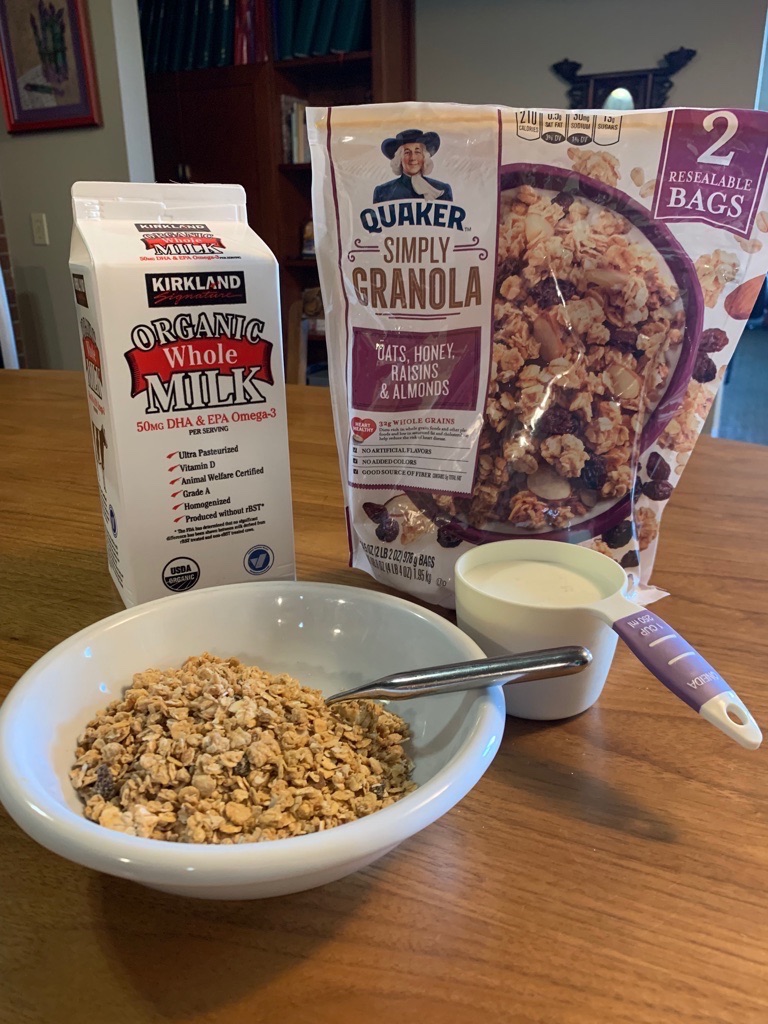
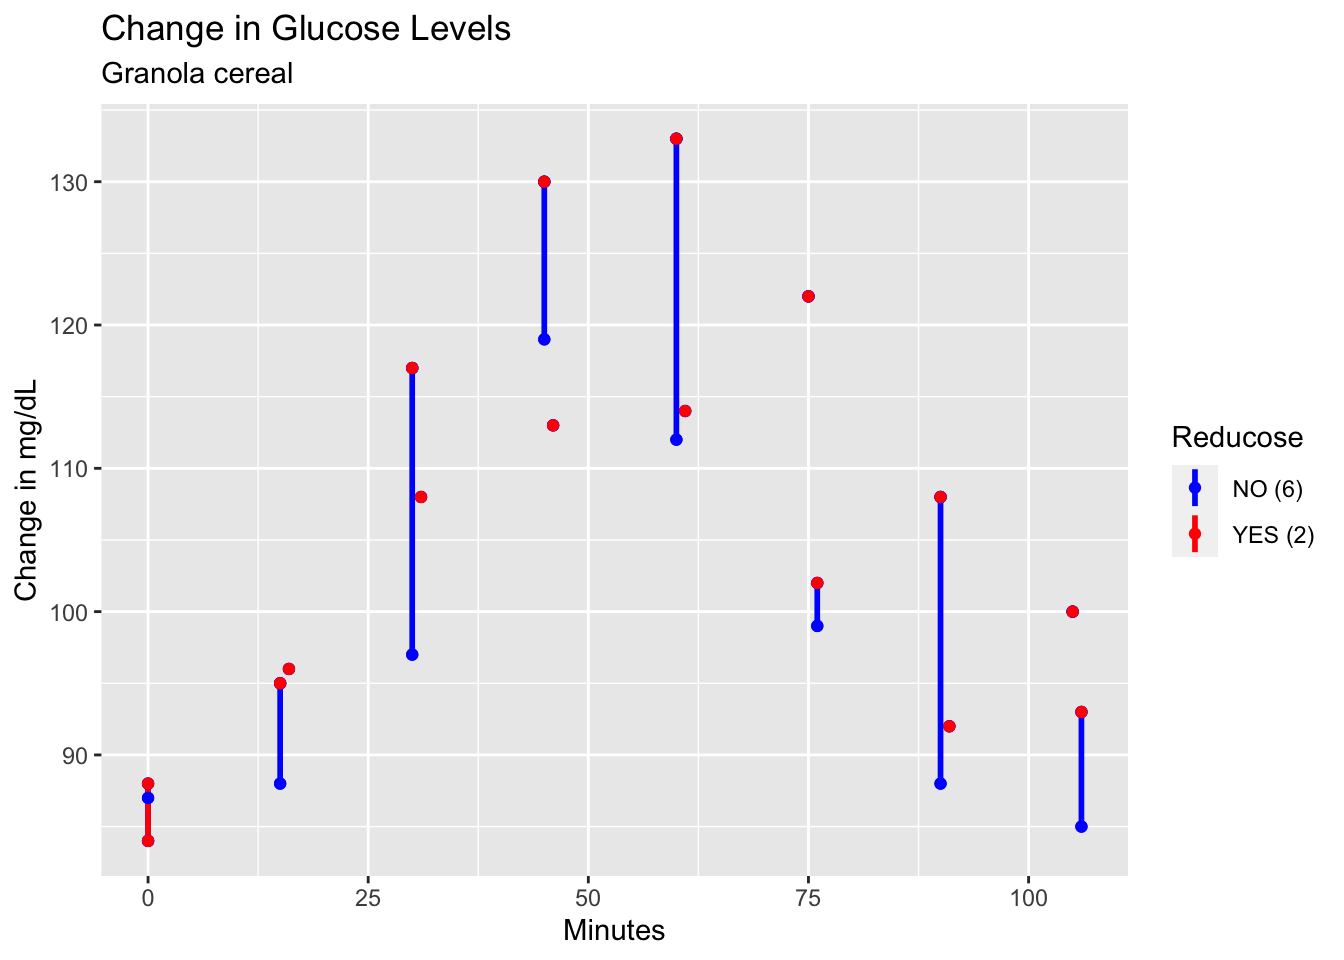
So I tried with some Quaker Oats Granola and milk, whose high sugar content usually produces a big glucose spike:
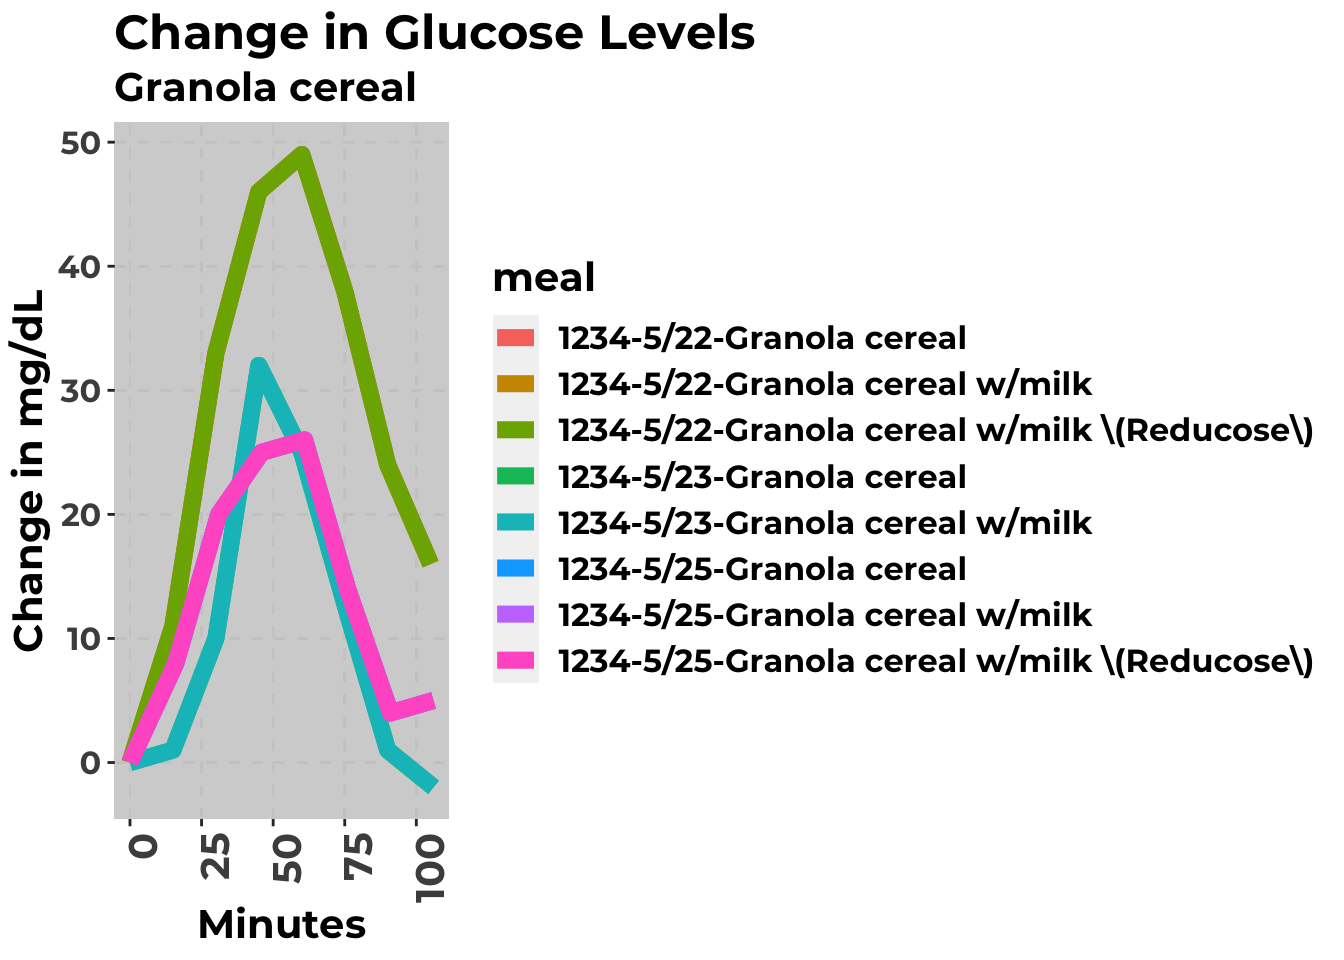
| Experiment | IAUC | Min | Max | Rise |
|---|---|---|---|---|
| 1234-5/23-Granola cereal | 1222 | -2 | 32 | -2 |
| 1234-5/23-Granola cereal w/milk | 1222 | -2 | 32 | -2 |
| 1234-5/25-Granola cereal | 1496 | 0 | 26 | 5 |
| 1234-5/25-Granola cereal w/milk | 1496 | 0 | 26 | 5 |
| 1234-5/25-Granola cereal w/milk \(Reducose\) | 1496 | 0 | 26 | 5 |
| 1234-5/22-Granola cereal | 3135 | 0 | 49 | 16 |
| 1234-5/22-Granola cereal w/milk | 3135 | 0 | 49 | 16 |
| 1234-5/22-Granola cereal w/milk \(Reducose\) | 3135 | 0 | 49 | 16 |
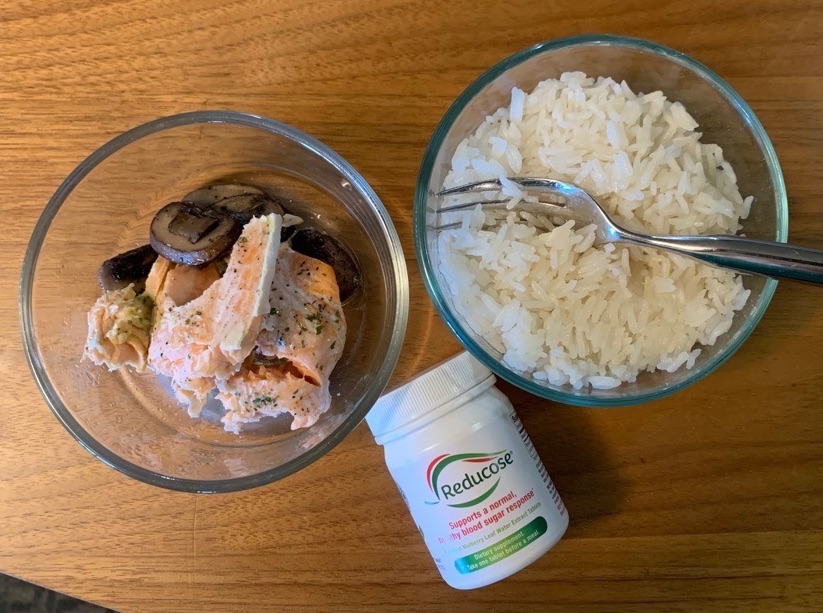
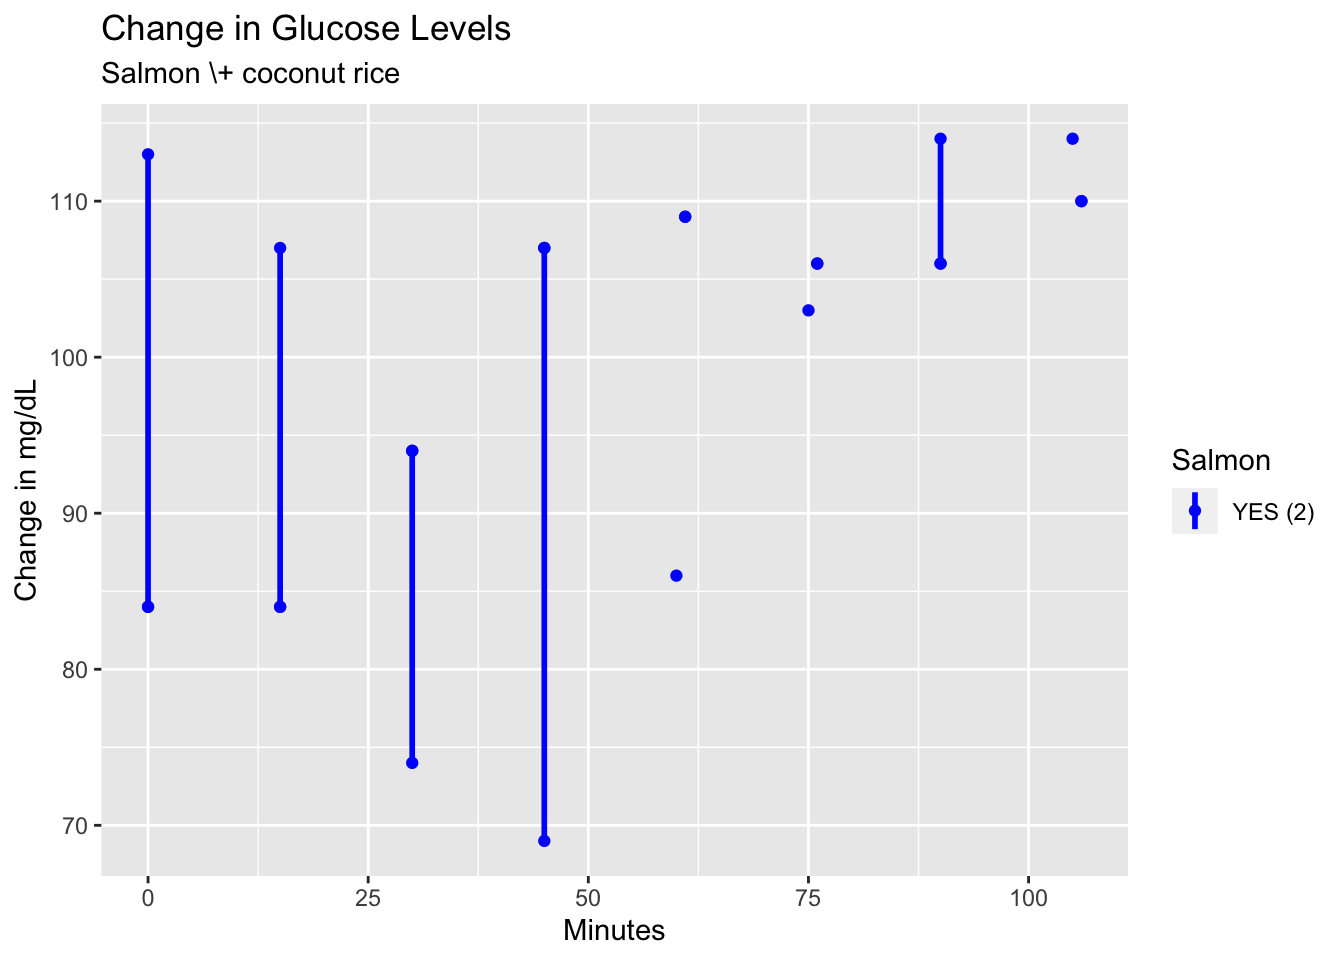
Then I tried it with some salmon and rice. This rice was boiled with a mixture of water and coconut milk for flavor as well as to add fat.
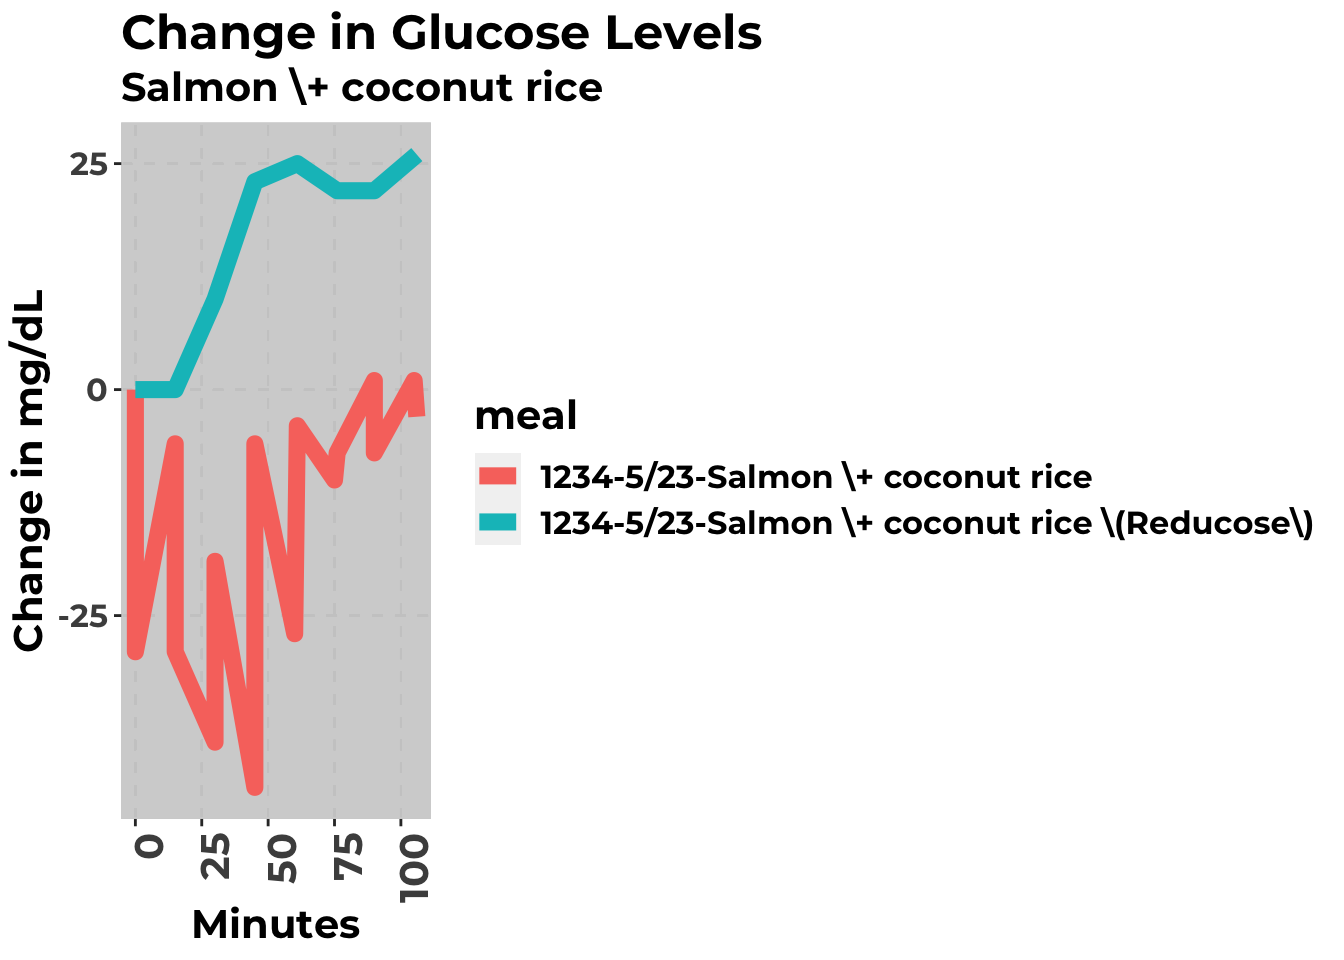
| Experiment | IAUC | Min | Max | Rise |
|---|---|---|---|---|
| 1234-5/23-Salmon \+ coconut rice | 2 | -44 | 1 | -3 |
| 1234-5/23-Salmon \+ coconut rice \(Reducose\) | 1751 | 0 | 26 | 26 |
foodname <- list( "Banana \\(Reducose\\)", "Banana \\(Reducose T\\-10\\)", "Banana \\(Reducose T\\-20\\)")

food_results_a <- cgmr::food_times_df(cgm_data = taster, foodnames=foodname)


cgmr::plot_food(food_results_a, foodname = foodname) + psi_theme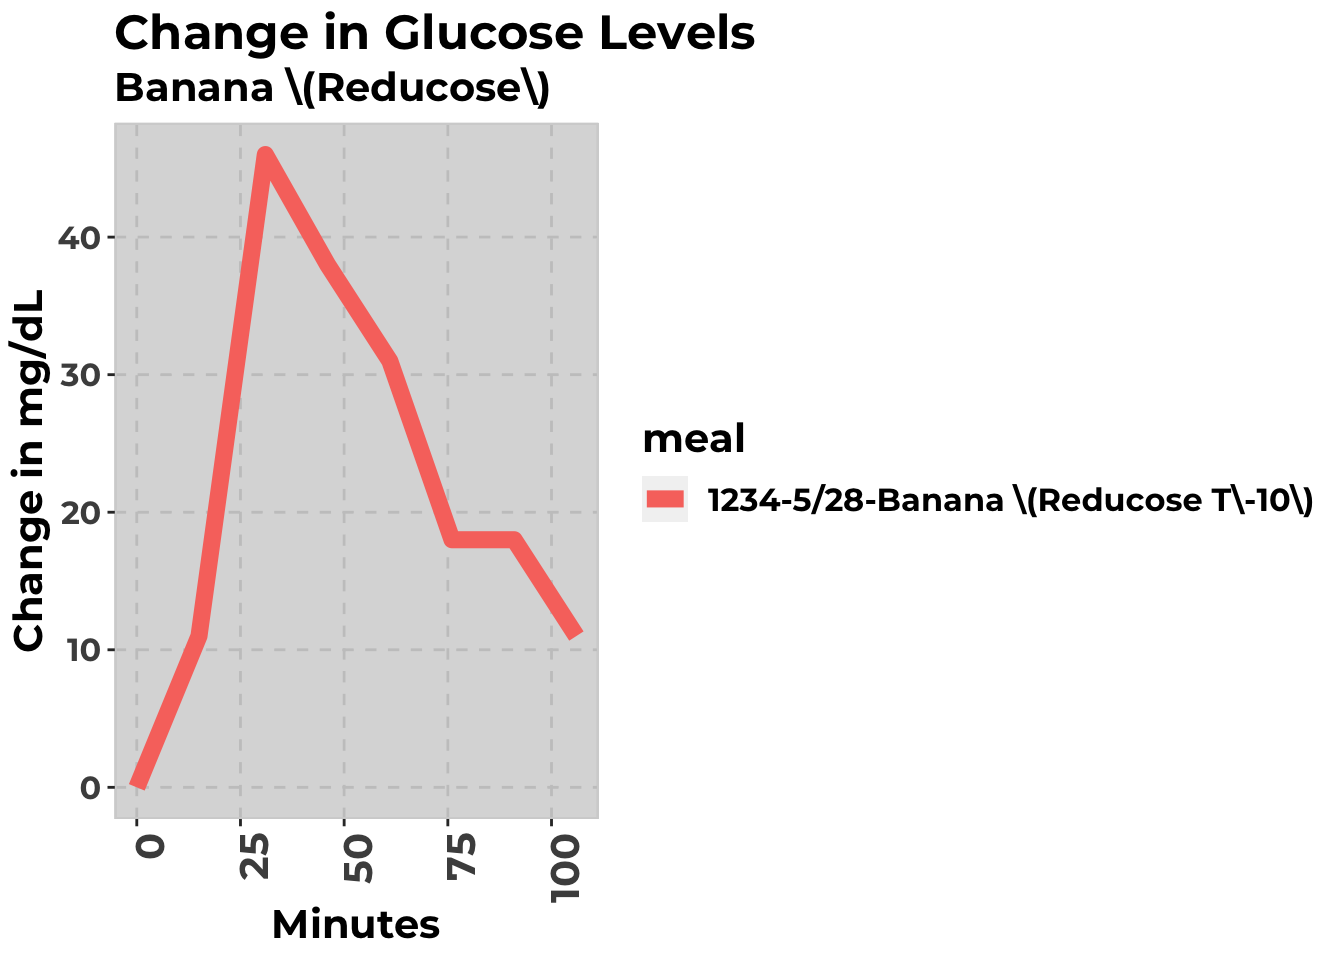
cgmr::food_table(food_results_a)  %>%
    kable(digits = 0) %>%
kableExtra::kable_styling(bootstrap_options = c("striped", "hover", "condensed"))| Experiment | IAUC | Min | Max | Rise |
|---|---|---|---|---|
| 1234-5/28-Banana \(Reducose T\-10\) | 2541 | 0 | 46 | 11 |
cgmr::plot_intervention(food_results_a, "banana")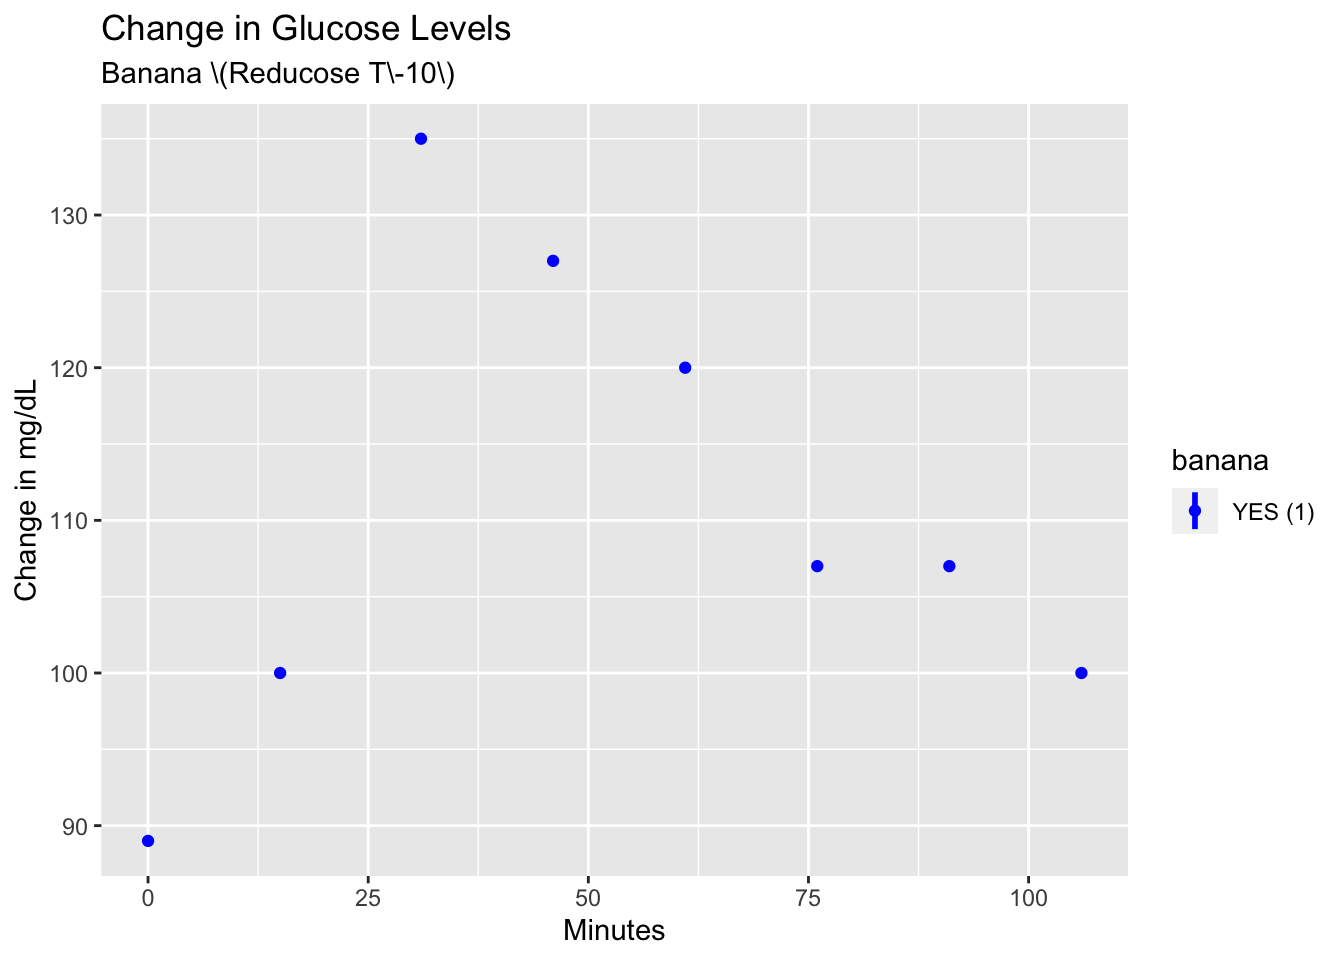
 foodname <- list("Oatmeal \\(plain\\)","Oatmeal w/milk","Oatmeal w/butter", "Oatmeal w/cinnamon", "Oatmeal \\(Reducose\\)")

food_results_a <- taster %>%
  {
    .$notes_records <- .$notes_records %>%
      filter(lubridate::year(Start) == 2019, lubridate::month(Start) == 5)
    .
  } %>%
  cgmr::food_times_df(foodnames = foodname)


cgmr::plot_food(food_results_a, foodname = foodname) + psi_theme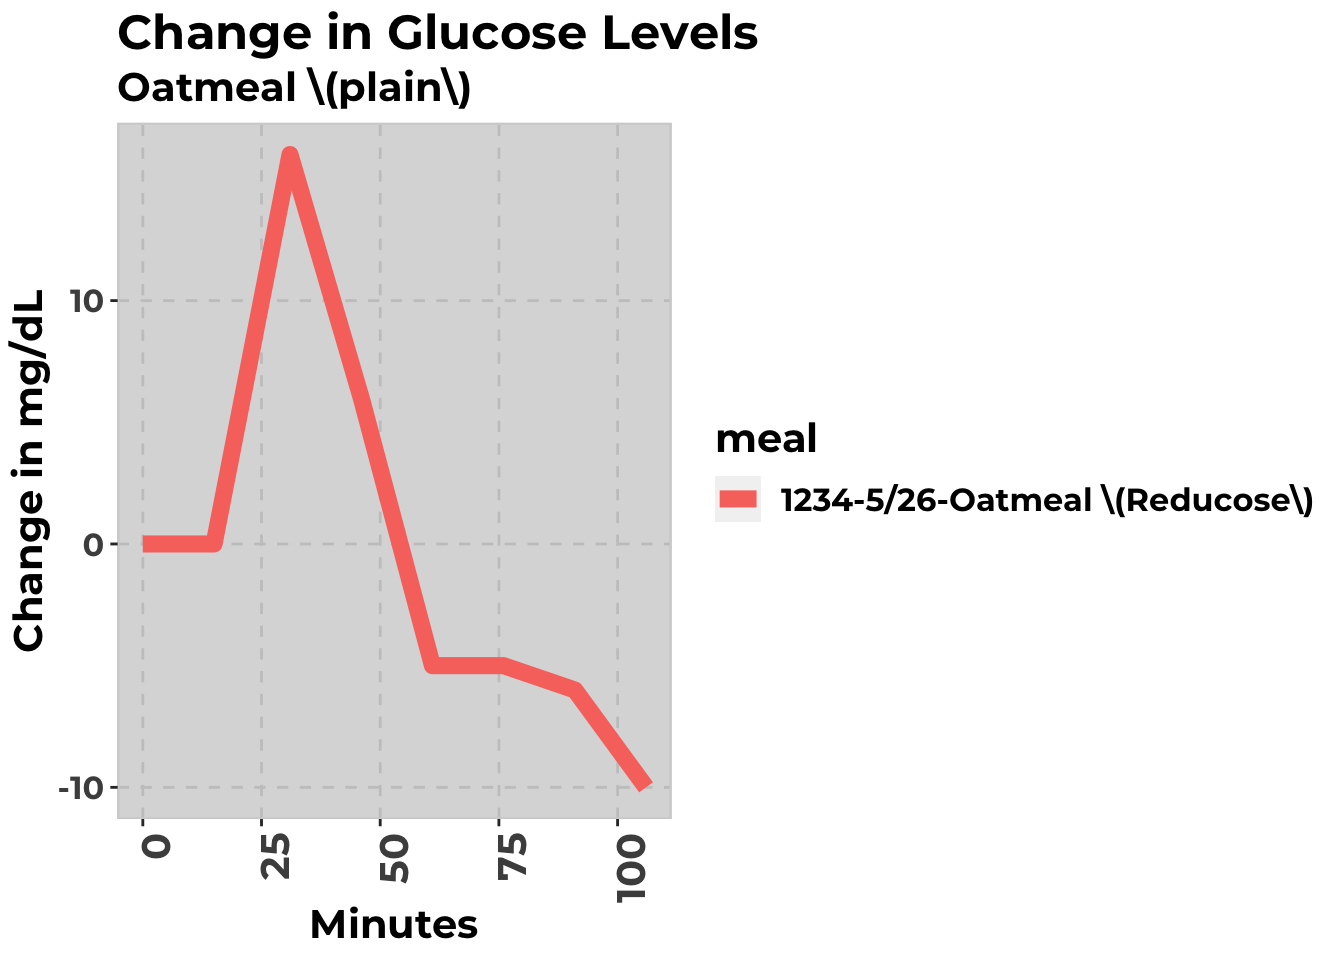
cgmr::food_table(food_results_a)  %>%
    kable(digits = 0) %>%
kableExtra::kable_styling(bootstrap_options = c("striped", "hover", "condensed"))| Experiment | IAUC | Min | Max | Rise |
|---|---|---|---|---|
| 1234-5/26-Oatmeal \(Reducose\) | 318 | -10 | 16 | -10 |
Each of these experiments was performed on a separate day, on an empty stomach.
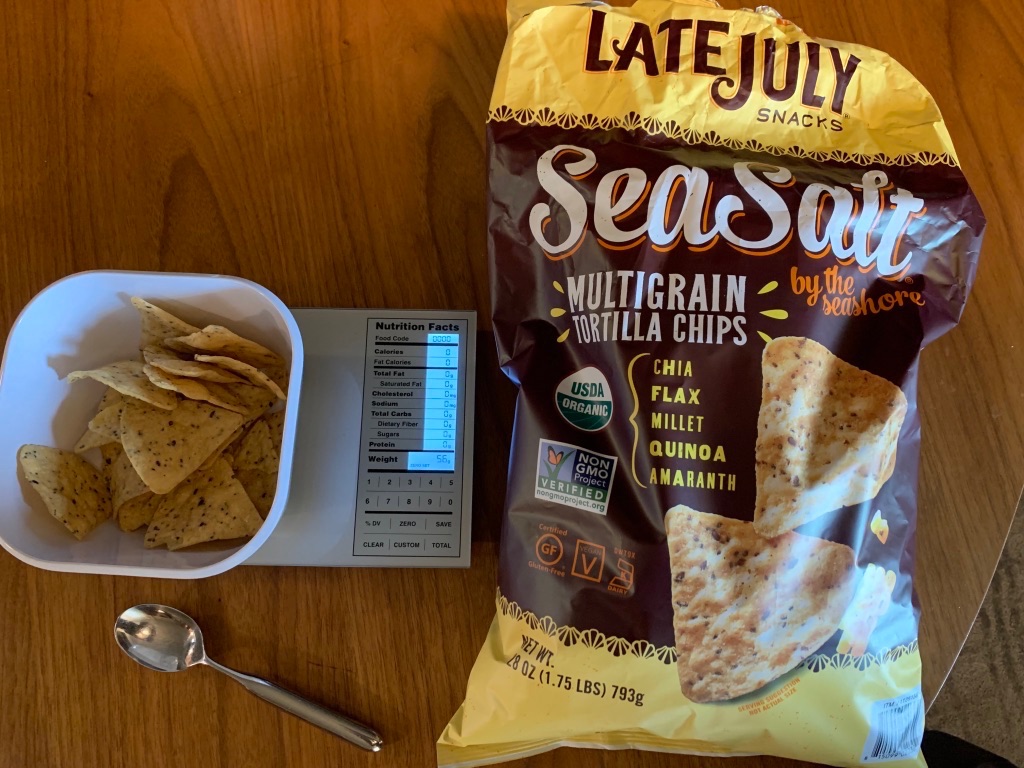
I also tried to understand how much Reducose will affect meals later in the day. After one of the banana experiments above, I waited three hours for my glucose to stablize again and then I ate some whole wheat chips.
foodname <- list("Chips", "Chips \\(Reducose\\)", "chips and guacamole")

food_results_a <- taster %>%
  {
    .$notes_records <- .$notes_records %>%
      filter(lubridate::year(Start) == 2019, lubridate::month(Start) == 5)
    .
  } %>%
  cgmr::food_times_df(foodnames = foodname)


cgmr::plot_intervention(food_results_a, intervention="Reducose") + psi_theme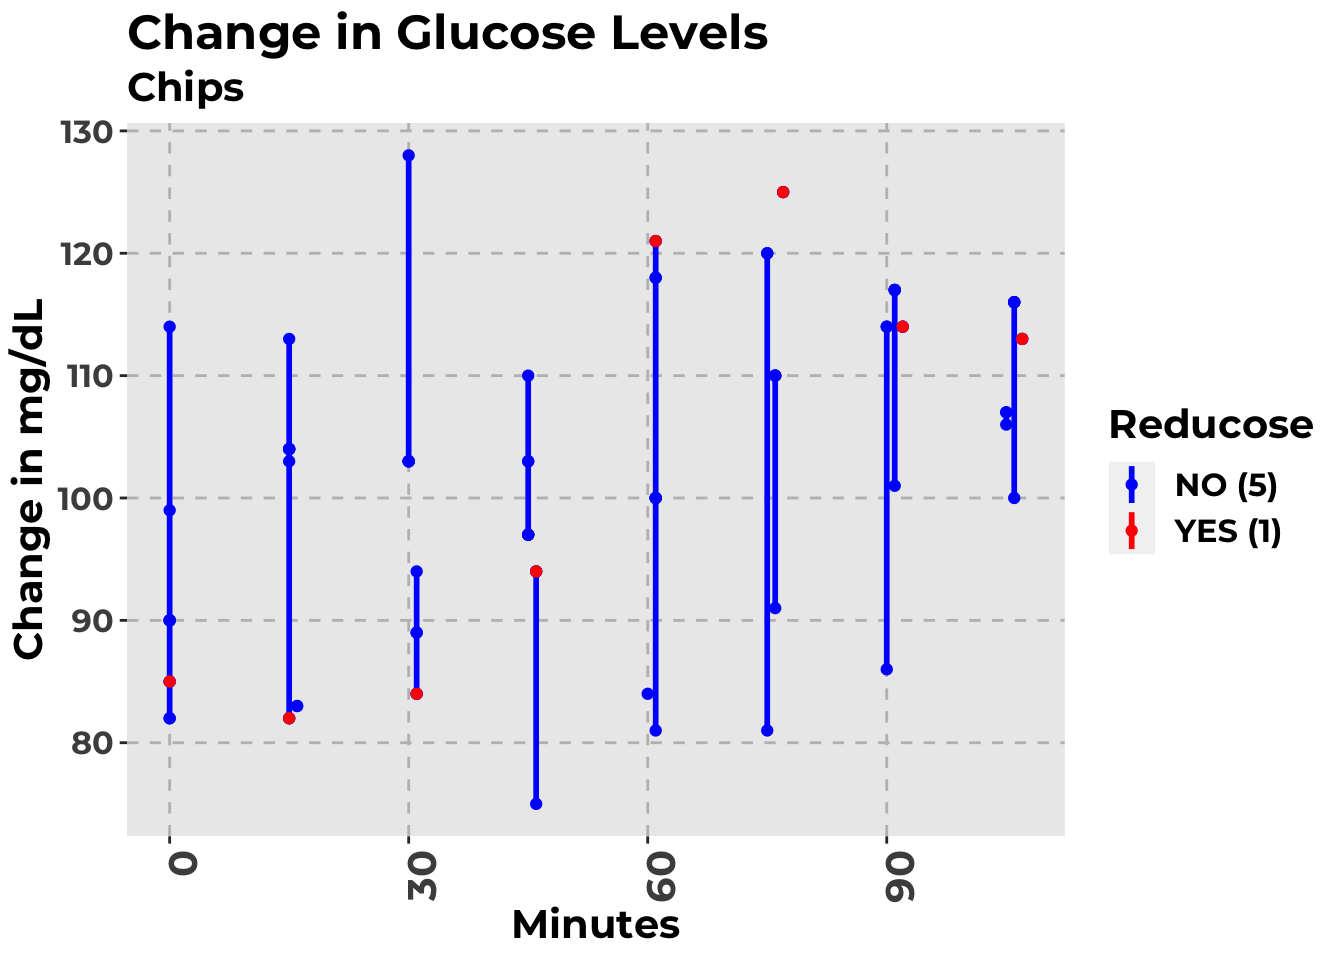
cgmr::food_table(food_results_a)  %>%
    kable(digits = 0) %>%
kableExtra::kable_styling(bootstrap_options = c("striped", "hover", "condensed"))| Experiment | IAUC | Min | Max | Rise |
|---|---|---|---|---|
| 1234-5/27-Chips | 70 | -24 | 4 | 1 |
| 1234-5/23-Chips | 1568 | 0 | 27 | 26 |
| 1234-5/23-chips and guacamole | 1568 | 0 | 27 | 26 |
| 1234-5/29-Chips | 1944 | -4 | 43 | 28 |
| 1234-5/29-Chips \(Reducose\) | 1951 | -3 | 40 | 28 |
| 1234-5/30-Chips | 2190 | 0 | 38 | 25 |
I don’t have conclusions yet because so many factors can influence this data and I’m not certain about my analysis. Stay tuned!