How well does a new soda help prevent my glucose spikes?
Author
Richard Sprague
Published
May 22, 2023
Good Idea®
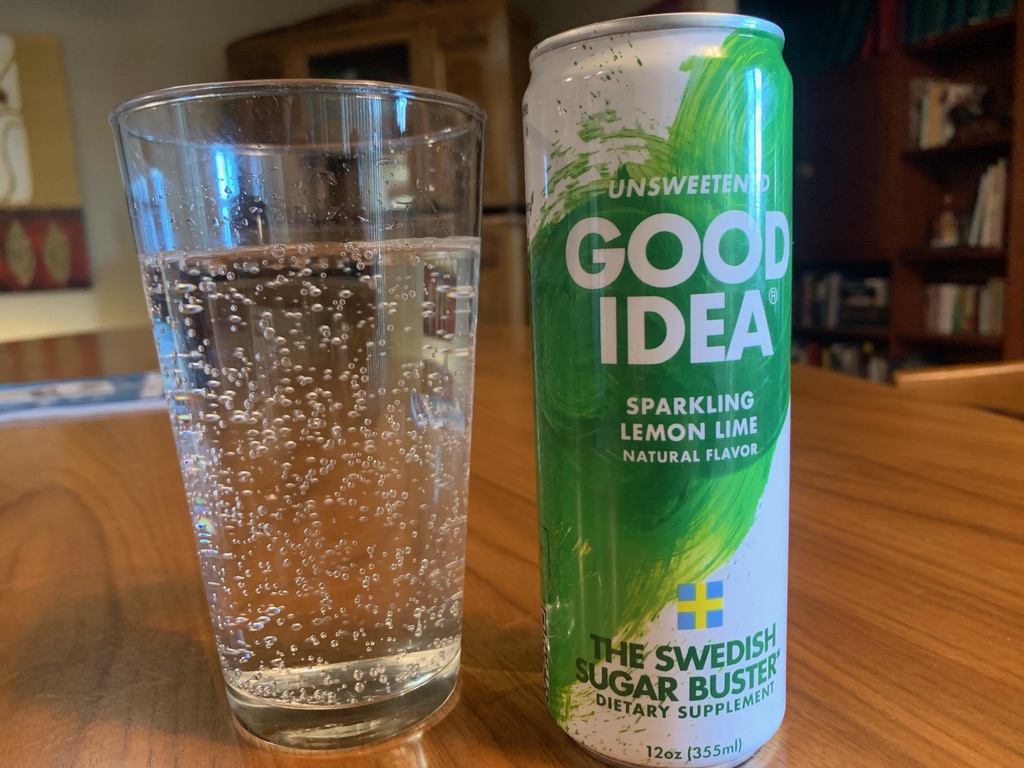
Good Idea®, “the Swedish sugar buster”, is a sparkling soft drink formulated with a proprietary blend of ingredients that claims to lower overall glucose levels when consumed before a meal. How well does it work for me?
My can of Good Idea: “The Swedish Sugar Buster”
My Personal Science Experiment
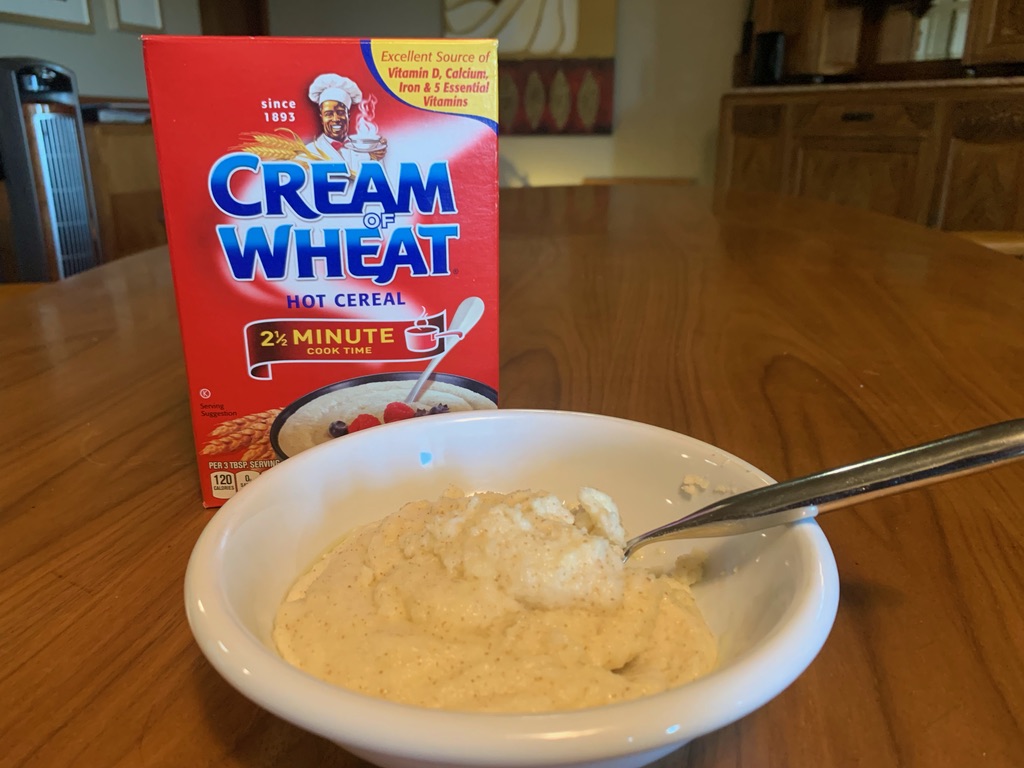
Wearing a Freestyle Libre™ continuous glucose monitor (CGM) on five different mornings on an empty stomach, I ate a bowl of Cream of Wheat mixed with 1/4 cup heavy cream and 1 TBS butter. This meal is about 500 calories, including 50g of net carbs and 35g of fat. I wanted a food that is generally considered “healthy”, with no sugar content, but high carb. I served it with a generous amount of fat to avoid significant glucose spikes.
I finished within five minutes and then I remained as sedentary as possible for the next two hours.
Instant Cream of Wheat is a high carb meal, which I loaded with extra fat
On one of those mornings I drank a can of Good Idea® fifteen minutes before the meal.
Show the code
## In the code above (not shown):## We pull the glucose data into r_glucose## and the metadata into r_notesif(require(cmgr)){devtools::install_github("personalscience/cgmr")}cgm_data <- cgmr:::cgm_data(r_glucose,r_notes)foodname <-"Cream of Wheat"# return all users who ate foodnamefood_results_a <- cgmr::food_times_df(cgm_data,user_id =1234,foodname = foodname)food_results <- food_results_a %>%group_by(meal) %>%arrange(t) %>%mutate(value = value -first(value)) %>%ungroup() %>%arrange(meal)new_foodnames <-c("Cream of Wheat (Plain)", "Cream of Wheat (Plain)", "Cream of Wheat (Goodidea)")food_results[food_results$meal=="1234-8/31-Cream of Wheat","meal"] <-"Cream of Wheat (Plain) #1"food_results[food_results$meal=="1234-9/2-Cream of Wheat","meal"] <-"Cream of Wheat (w/GoodIdea)"food_results[food_results$meal=="1234-9/1-Cream of Wheat","meal"] <-"Cream of Wheat (Plain) #2"food_results[food_results$meal=="1234-9/5-Cream of Wheat","meal"] <-"Cream of Wheat (Plain) #3"food_results[food_results$meal=="1234-9/8-Cream of Wheat","meal"] <-"Cream of Wheat (Plain) #4"
Show the code
food_results %>%group_by(meal) %>%arrange(t) %>%mutate(value = value -first(value)) %>%ungroup() %>%arrange(meal) %>%#transmute(t,value,meal = paste(foodname,date_ch)) %>%ggplot(aes(x=t,y=value, color = meal)) +geom_rect(aes(xmin=0,xmax=120, #max(Date),ymin=-Inf,ymax=Inf),color ="lightgrey", alpha=0.005) +geom_line(linewidth=3) +labs(title ="Change in Glucose Levels", subtitle =sprintf("%s",foodname), y ="Change in mg/dL", x ="Minutes") +# ylim(-50,100)+ psi_theme
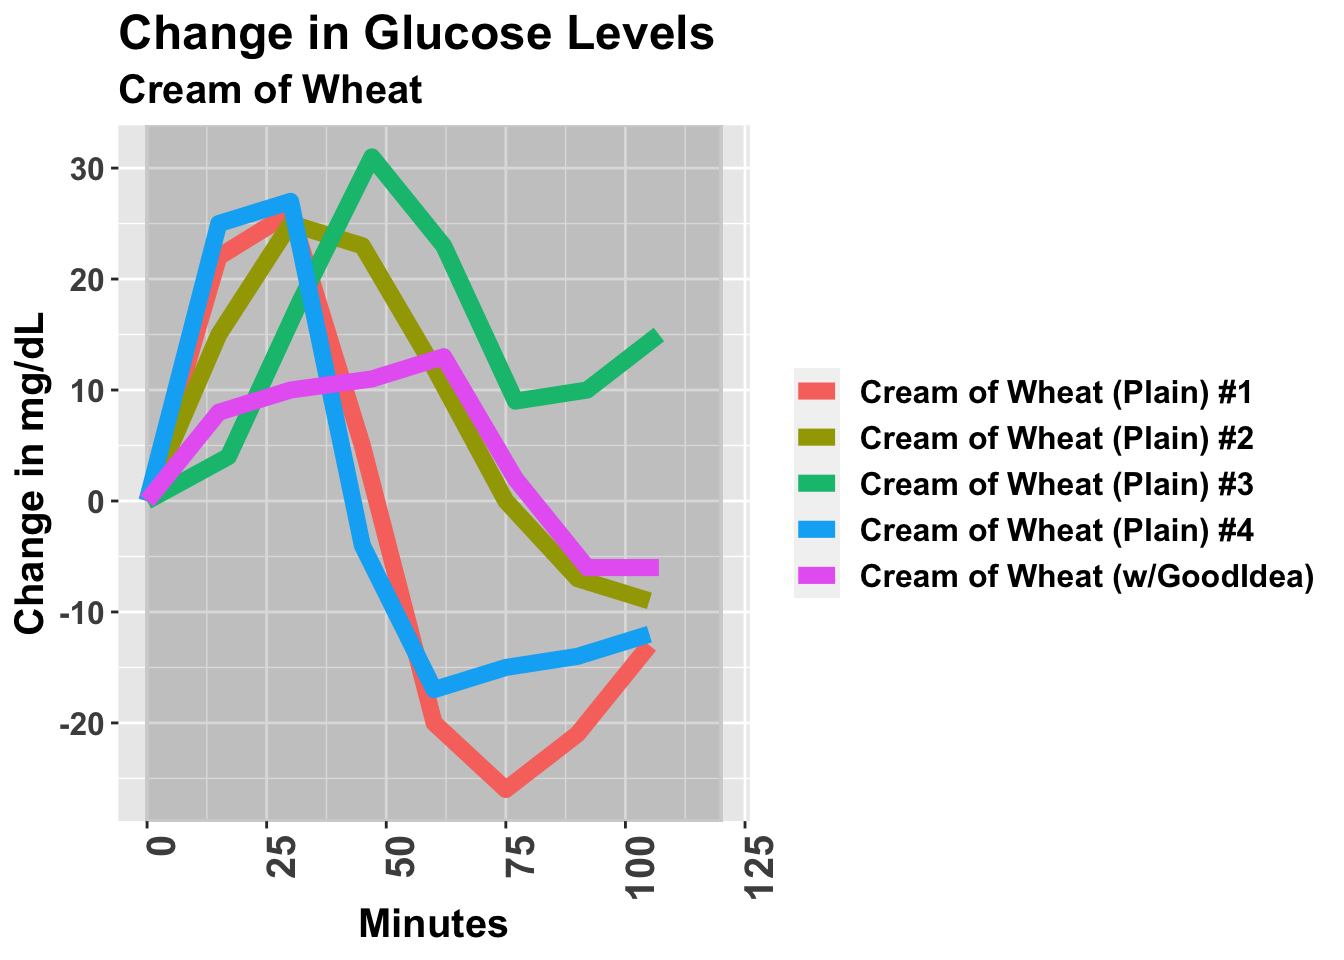
This chart shows an obvious spike soon after plain Cream of Wheat meals, climbing at least 20 points within the first half hour. (Note: the values here are normalized so all meals start at 0). By contrast, the meal that followed a glass of Good Idea® seemed more stable.
Interestingly, in several of the plain meals, my glucose level was actually lower at the end than at the beginning, a “sugar crash” after eating such a high carbohydrate load. Good Idea®, on the other hand, gave no such crash.
iAUC is a standard method that nutrition scientists use to calculate the overall effect of glucose changes. “Incremental Area Under the Curve” uses a simple sum of the area of all the trapezoids under the curve marked out by the various CGM measurements.
Conclusions
With such a small sample, we can’t say definitively but the relatively small rise on the day I drank the Good Idea® points to some effect.
Show the code
DBI::dbDisconnect(con)
More
For more details about this experiment, plus others that I write about weekly, subscribe to this free weekly newsletter: