R-tude: My Bifido Levels by month
R tutorial creating a calendar heatmap visualization of Bifidobacterium gut microbiome abundance levels tracked over multiple years.
Inspired by a Datascience.com post by Raul Eulogio on Apple Watch data analysis in R, I decided to try to make a simple calendar-type display of my microbiome data.
My years of microbiome data are already available in the Phyloseq object
sprague.genus.norm, so I simply turn that object into an ordinary data
frame using a helper function from my psmr package.
To simplify things, I’ll steal this helper function (from here) that can turn a date/time field into separate columns for year, month, and weekday.
#' Extracts datetime meta data
#'
#' @param data_frame respective dataframe which contains column(s)
#' @param col column within dataframe that will be utilized to extract months, year, and weekday metadata \code{lubridate::as_datetime}
#' @return Dataframe with column converted to datetime

extract_date_data <- function(data_frame, col_name){
  col_name <- enquo(col_name)
  months_list <- c("January", "February", "March",
                   "April", "May", "June", "July",
                   "August", "September", "October",
                   "November", "December")
  # Make sure column is datetime
  tryCatch({
      # Extract the months and create a column
      data_frame <- data_frame %>%
        mutate(months = lubridate::month(!!col_name, label = TRUE)) %>%
        mutate(year = lubridate::year(!!col_name)) %>%
        mutate(week_days = lubridate::wday(!!col_name, label = TRUE))

      data_frame
      }, error = function(c){
        message(paste0("Column '", quo_name(col_name), "' not in correct format"))
        stop(c)
      })
  }
Note a few cool techniques in that helper function. enquo() and its
counterpart !! are tidyeval functions that let me pass a variable and
have it be evaluated as if it were quoted.
Now find the abundances of the one Bifido taxa and convert it into a
simple data frame (using psmr::mhg_taxa):
bifido <- psmr::mhg_taxa(sprague.genus.norm, "Bifidobacterium") %>%
  transmute(Date = date, Abundance = abundance/ 10000) %>%
   extract_date_data(Date)

head(bifido)
## Date Abundance months year week_days
## 1 2014-05-16 33.3142 May 2014 Fri
## 2 2014-06-06 0.0000 Jun 2014 Fri
## 3 2014-06-06 0.6561 Jun 2014 Fri
## 4 2014-06-06 0.0000 Jun 2014 Fri
## 5 2014-06-06 0.0000 Jun 2014 Fri
## 6 2014-06-06 0.0000 Jun 2014 FriNow turn that simple data frame into a calendar.
bifido %>%
mutate(week_date = ceiling(day(Date) / 7)) %>%
group_by(week_date, months, week_days) %>%
# summarise(total_cal = sum(value)) %>%
ggplot(.,
     aes(week_days, week_date, fill = log10(Abundance))) +
geom_tile(colour = "white") +
facet_wrap(~months) +
theme_bw() +
scale_fill_gradient(name = "Abundance \n(log10 %)",
                    low = "#39a78e", high = "#a73952") +
labs(title = "Bifido Throughout the Year",
     x = "Week of the Month",
     y = "Weekday") +
scale_y_continuous(trans = "reverse") + theme(axis.text.x = element_text(angle = 90))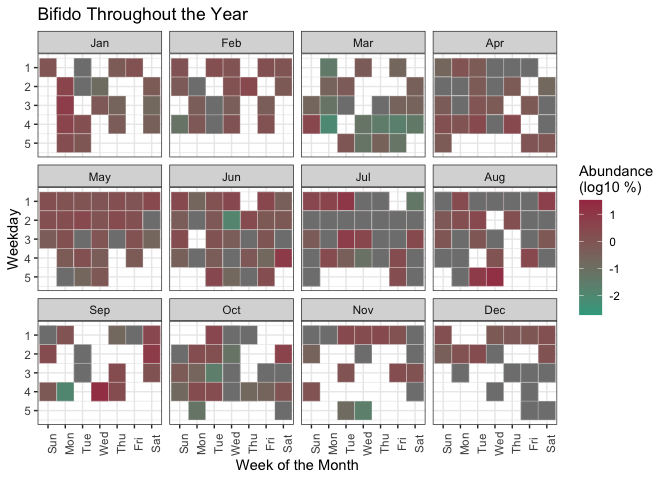
that’s it!